Power BI Interview Questions and Answers for 2025

Last Updated: May 7, 2025

Are you preparing for a Microsoft Power BI interview and not sure what to expect? No worry we at EmergenTeck created a detailed guide that covers the most frequently asked Power BI interview questions and answers for both freshers and experienced professionals. Whether you’re preparing for your first job role or stepping into a senior position, this detailed of questions and answers with pdf and tutorials guide are designed to help you feel confident and ready. from core concepts to real-world implementation insights, you’ll find clear explanations that reflect the practical knowledge employers look for in top Power BI candidates.

What’s Included in the Interview Q&A Guide?
✅ Microsoft Power BI Interview Questions & Answers​
✅ Questions for Freshers and Entry-Level Candidates​
✅ Power BI Interview Questions for Experienced Professionals​
✅ Key Concepts: Main Components of Power BI​
✅ Topics on Database Automations and examples ​
✅ Overview of powerbi Framework​
✅ Power BI Tutorials for Practical Learning
✅ Certification Guide with PDFs​
✅ OnDemand Interview questions with answer & FAQ

1) What is Power BI, and can it be used for capturing data from end users?

The full form of Power BI is Power Business Intelligence. Power BI is primarily a data visualization tool that transforms raw data into graphical formats like charts and reports. However, it is not designed to capture or input data from end users like forms or web apps. It focuses on consuming and visualizing data from various data sources.

2) What are the main components of Power BI?

The main components include Power BI Desktop (free desktop app for report  creation), Power BI Service (cloud based service for publishing and sharing), and earlier there was Power BI Report  erver for on premises deployment, though many organizations have moved to the cloud se vice hosted by Microsoft.

3) Can you explain the difference between Power BI Desktop and Power BI Service?

Power BI Desktop is where developers create reports and transform data locally. Power BI Service is an online SaaS platform where reports are published, shared, and scheduled for data refreshes. The Service provides collaboration and dashboard sharing features.

4) What is the difference between Import mode and DirectQuery in Power BI?

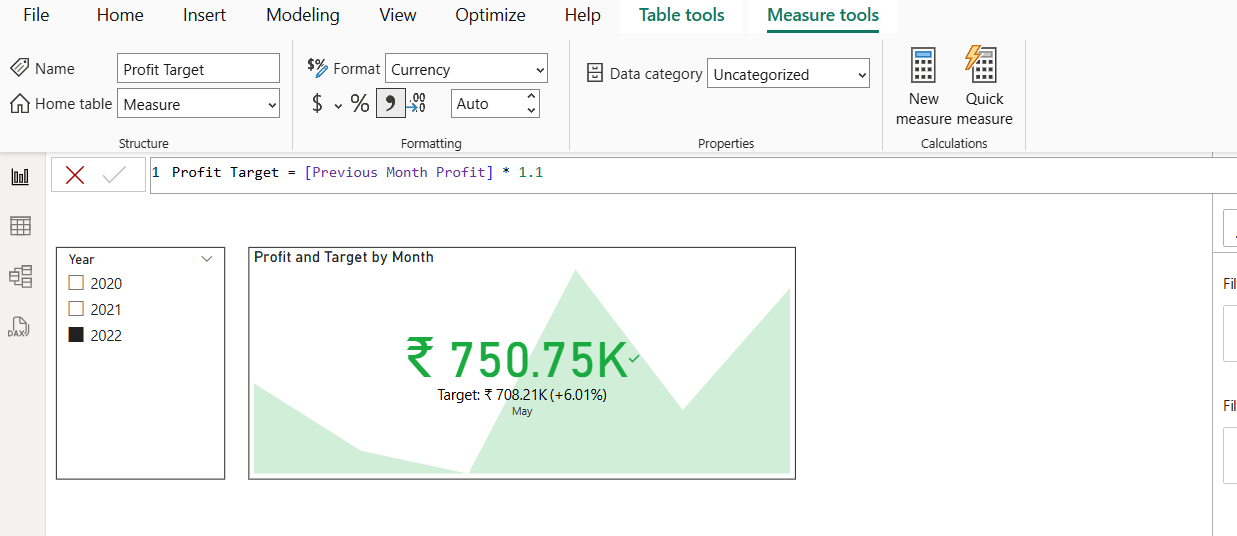
In Import mode, data is imported and stored inside Power BI;trans ormations and visualizations work on  he local copy. Scheduled refreshes update this data at intervals. DirectQuery connects live the source, allowing real-time data updates in reports but comes with some feature li itations and performance considerations. 

5) How do you decide whether to use Import or DirectQuery mode?

Use Import mode for faster performance and complex calculations, especially with smaller data sets that can be refreshed periodically. Use DirectQuery when working with large datasets that must refect real-time data without latency and when data governance prefers data staying in source systems. 

Get a Free Demo

Learn How to Begin Today!

6) What is data transformation in Power BI, and why is it important?

Data transformation, done in Power Query Editor, involves cleaning, filtering, and shaping data (removing duplicates, handling nulls, data type changes) before creating visualizations, ensuring the data fed into reports is accurate and reliable.

7) Can Power BI automatically detect data types? How?

Yes, Power BI can automatically detect data types during data load. This is controlled via the setting “Always detect column types and headers for unstructured sources,” which helps avoid manual data type conversion.

8) What is Power Query M language, and do you need to write it manually?

M is the scripting language Power Query uses to perform ETL operations. Typically, Power BI auto generates the M code when you apply transformations via UI, but knowing M syntax helps in debugging an creating advanced custom queries. 

9) Explain the concept of “Applied Steps” in Power Query Editor?

Applied Steps record every transformation action sequentially. They are reusable and can be edited or deleted, allowing developers to track, manage, and alter data preparation actions systematically. .

10) How do you handle null values or unwanted data in Power BI?

You filter out nulls or unwanted rows during the transformation phase by applying filters in Power Query Editor or using DAX functions post-load to clean data before visualization.
Microsoft Power BI Market Share

11) What is the importance of the ‘Promote Headers’ step during data transformation?

When raw data lacks defined headers, Power BI can promote the first row of data to be column headers, which is critical to properly recognizing the dataset’s structure.

12) Can Power BI connect to databases other than SQL Server?

Yes, Power BI supports many  data sources including Oracle, SAP HANA, Amazon services, IBM DB2, SharePoint, and many others, accessible via certified connectors or custom connectors. 

13) What are the key differences when connecting to a data source via SQL Query vs. Tables?

Connecting via SQL Query means the SQL team or DB admin provides a query that  pre aggregates or prepares the exact data needed, reducing developer workload. Connecting via Tables requires the developer to build relationships and transformations  themselves. 

14) What is the function of the Global and Current File settings in Power BI?

Global settings affect all PowerBI reports on the desktop app, while Current File settings apply only to the specific Power BI project you are working on. This distinction helps manage configurations per user needs or per project. 

15) Describe the steps to handle caching issues in Power BI Desktop.

If reports are slow or data does not refresh properly, clearing cache from Power BI desktop’s options can help by deleting stored temporary data, similar to clearing browser cache.

Learn How to Get Started with Microsoft Power Platform!

16) What is the use of Q&A visual in Power BI reports?

Q&A allows users to interact with the report using natural language queries, so users can ask questions like “Which region has the highest sales?” and get instant visual answers, enhancing report interactivity.

17) How do you schedule data refreshes in Power BI?

Data refresh schedules are setup in Power BI Service, allowing datasets imported into Power BI to refresh at specific intervals (e.g., every 30 minutes), ensuring reports 
contain updated data. 

18) How do you manage authentication when connecting to data sources like SharePoint or web data in Power BI?

Power BI requires authenticat on for protected data sources. It can use browser- based authentication, Microsoft credentials, or configured certificates to validate 
connections securely. 

19) What are preview features in Power BI, and should they be used in production environments?

Preview features are experimental options released for early testing. They can be 
enabled in settings but should be used cautiously in production because they might change 
or be removed later. 

20) Explain co-pilot functionality in Power BI Desktop.

Co-pilot is an AI assistant feature that helps users with guidance, suggesting steps to build reports or write queries, but it does not build complete reports automatically. It’s a support tool rather than a full developer replacement.
Job Market for Power Bi Professionals update

21) How would you design a Power BI dashboard to visualize customer churn trends?

Use line charts for churn trend over time. 
Cards for churn KPIs (e.g., churn rate, retention rate). 
Bar charts for churn reasons. 
Slicers to filter by region, subscription type, etc. 
Add drill-through pages for detailed customer analysis. 

22) Write a DAX measure to calculate year-over-year revenue growth?

YoY Revenue Growth (%) = DIVIDE( [Total Revenue] – CALCULATE([Total Revenue], SAMEPERIODLASTYEAR(‘Date'[Date])), CALCULATE([Total Revenue], SAMEPERIODLASTYEAR(‘Date'[Date])) )

23) Create a DAX measure to compute running total sales for a selected time period?

Running Total Sales = 
CALCULATE( 
    SUM(‘Sales'[Amount]), 
    FILTER( 
        ALLSELECTED(‘Date'[Date]), 
        ‘Date'[Date] <= MAX(‘Date'[Date]) 
    ) 
) 

24) What is CALCULATE & CALCULATE TABLE?

CALCULATE returns a single value by changing the filter context. 
CALCULATETABLE returns a table after applying new filters. 

25) What are other functions used other than SUMMARIZE?

GROUPBY 
     SUMMARIZECOLUMNS 
     ADDCOLUMNS 
     SELECTCOLUMNS 

Get a Free Career Counselling Session & Live Demo!

26) Difference between SUMMARIZE & SUMMARIZE COLUMNS?

SUMMARIZE: Requires a table argument and is flexible but older. 
SUMMARIZECOLUMNS: More optimized, does not require a table argument, ignores row 
context. 

27) What is pro storage capacity?

10 GB per user in Power BI Prolicense. (subject to verified from official site on for latest update) 

28) What is the difference between filtering data in CALCULATE with and without FILTER Expression

Without FILTER: Simple column filters. 
With FILTER: Row-level filtering, better for complex conditions. 
 

29) Do you know about gateways?

Used to securely connect on-premises data sources with the Power BI Service for refresh and live queries.

30) How do you implement drill-through functionality in Power BI?

Create a new page. 
Add fields into the Drill-through Filters pane. 
Right-click visuals to drill-through to that page with filtered data. 

31) How do you optimize performance in Power BI?

Reduce number of visuals. 
Use Import mode when possible. 
Avoid complex DAX measures on visuals. 
Use aggregations and query folding. 

32) How do you use the Q&A feature in Power BI?

Add a Q&A visual.
ask natural language questions (like “Top n customers”) and get instant answers. 
Define synonyms in the model for better matching. 

33) How do you manage large datasets in Power BI?

Aggregate tables. 
Use DirectQuery or Composite models. 
Partition large fact tables. 
Limit number of columns and reduce cardinality. 

34) How do you handle relationships with many-to-many cardinality?

Use bridge tables when possible. 
Set relationship type to many-to-many carefully. 
Avoid circular relationships.

35) What is the difference between all and all selected in powerbi?

ALL – Ignores all filters completely. 
ALLSELECTED – Ignores filters but respects slicer selections. 

36) SCENARIO: Rolling 12 months average sales?

Rolling 12M Avg Sales = 
AVERAGEX( 
   DATESINPERIOD(‘Date'[Date], MAX(‘Date'[Date]), -12, MONTH), 
    [Total Sales] 
) 

37) SCENARIO: How to find the last 7 days' total sales?

Last 7 Days Sales = 
CALCULATE( 
  SUM(‘Sales'[Amount]), 
   DATESINPERIOD(‘Date'[Date], MAX(‘Date'[Date]), -7, DAY) 
) 

38) How many active relationships are possible between tables in Power Pivot models, and how many inactive ones can they have?

Only one active relationship between two tables. Multiple inactive relationships are allowed. 

39) Write a DAX formula to categorize customers into High, Medium, and Low spenders based on their total purchase value.

Customer Category =  
SWITCH( 
    TRUE(), 
    [Total Purchase] > 50000, “High”, 
    [Total Purchase] > 20000, “Medium”, 
    “Low” 
) 
 

40) How would you restrict data access in Power BI using Row-Level Security (RLS) based on a user’s department?

Define roles in Power BI Desktop. 
Apply DAX filters (e.g., ‘Department’ = USERPRINCIPALNAME()). 
Publish and assign users to roles. 

41) How do you highlight low-performing products dynamically in a Power BI report?

Use Conditional Formatting on visuals like tables or bar charts. 
Create a DAX measure to define thresholds: 
Performance Status =  
IF([Sales] < 10000, “Low”, “Good”) 
Apply color rules: Red for low-performing, Green for good-performing products. 
Optionally, add dynamic KPIs or custom tooltips. 

42) Explain the process of creating a Power BI Dataflow for consolidating sales data from multiple sources?

Go to Power BI Service → Workspace → Create → Dataflow. 
Choose Add New Tables. 
Connect to multiple data sources (SQL Server, Excel, Salesforce, etc.). 
Use Power Query Online to clean and transform the data. 
Save and load the dataflow. 
Link dataflow to Power BI Desktop to use consolidated data across multiple reports. 

43) What are some best practices for improving Power BI report performance and refresh speed?

Use Import mode instead of DirectQuery when possible. Reduce visuals per page. 
Avoid unnecessary columns and rows. 
Pre-aggregate large tables before importing. 
Use query folding in Power Query. 
Optimize DAX by using simple measures. 
Turn off auto date/time in the data model if not needed. 

44) How many tables you can append & merge?

Append- You can append two or more tables – no fixed limit officially. You can append as many tables as your system memory and Power Query performance can handle efficiently. Merge- You can merge two tables at a time in a single merge operation. However, you can perform multiple sequential merges to combine additional tables if needed.

Join Our Updated Microsoft Power Automate Course - Stay Ahead in Agentic Automation!

45) Remove duplicate records from a dataset?

Open Power Query Editor.
Select the columns you want to check for duplicates.
Go to the Home tab → Remove Duplicates.
Duplicates will be removed based on selected columns. 

46) Split a single column into multiple columns based on a delimiter?

In Power Query, select the column. 
Go to Home → Split Column → By Delimiter. 
Choose the delimiter (e.g., comma, space, hyphen). 
Decide to split into two or more columns based on delimiter occurrence. 

47) Merge two datasets with different primary keys?

In Power Query, use Merge Queries. 
Select columns that can logically link the two datasets (even if they are not exact keys). 
Use a custom join (inner, left outer, etc.). 
After merging, expand the columns you need from the second table. 

48) What are the important KPIs for the Project?

Sales Revenue Growth Rate 
Customer Retention Rate 
Churn Rate 
Average Deal Size 
Inventory Turnover Rate 
Profit Margin 
On-time Delivery Rate

49) What are the best practices followed for Data Modeling, Data visualization, Data transformation?

  • Data Modeling- Use Star Schema, remove unnecessary columns, normalize date tables, set correct data types. 
  • Data Visualization- Focus on simplicity, consistent colors, limit visuals per page, highlight insights, use tooltips/bookmarks. 
  • Data Transformation Push transformations to source if possible, maintain query folding, remove unnecessary steps, document transformations. 

50) If any performance issues faced, how it is rectified?

Identified heavy DAX calculations and optimized them (eg., reduced nested 
iterations). 
Reduced number of visuals and used summarized tables. 
Split large datasets into smaller partitions or pre-aggregated at source level. 
Enabled Incremental Refresh for large tables. 
Optimized relationships (e.g., single-directional filters unless bi-directional was 
necessary). 
Power BI and AI future

51) What is the difference between SUMMARIZE and SUMMARIZECOLUMNS?

SUMMARIZE: 
Requires a table argument first. 
Supports row context. 
More flexible but less optimized. 
Older function. 
SUMMARIZECOLUMNS: 
Does not require a table argument. 
Ignores row context. 
Optimized for performance. 
Newer, recommended function. 

52) How is data validation done in Power BI?

Cross-check imported data with source records. Use profiling tools in Power Query (Column Distribution, Quality, Profile). Apply summary statistics (sum, count) to verify completeness. 
Compare totals and counts after transformations. Perform spot checks using sampling and visual validation. 

53) What is the difference between SKIP and DENSE in Rank?

SKIP RANK: 
Skips a rank after a tie (1,1,3). 
Next rank is +2 if tie occurs. 
DENSE RANK: 
No gaps after tie (1,1,2). 
Next rank is +1 if tie occurs. 

54) Manual or Scheduled refreshed for data?

Manual Refresh: 
Triggered by user manually. 
Good for ad-hoc updates. 
Immediate. 
Scheduled Refresh: 
Automatic at defined intervals. 
Good for regular updates (daily/hourly). 
Background and automated. 

55) How is sharing and collaboration done with stakeholders?

Publish reports to Power BI Service. 
Share reports directly or via workspaces. 
Use Apps to bundle and distribute multiple reports. 
Set Row-Level Security for personalized views. 
Collaborate via Teams, SharePoint, or email links. 

Microsoft Power Automate Interview Question & Answer.

56) Explain the difference between EARLIER and EARLIEST functions in DAX?

EARLIER: 
Refers to the previous row context. 
Mainly used for nested row contexts. 
EARLIEST: 
Refers to the outermost row context.Useful when multiple nested contexts exist and you want the outermost value. 

57) How would you calculate the rank of a customer based on their sales in Power BI using DAX?

Customer Rank =  
RANKX( 
    ALL(‘Customer'[CustomerName]), 
    [Total Sales], 
    , 
    DESC, 
    DENSE 
) 

58) What is Field Parameters in Power BI? Or How to create a dynamic Axis using a slicer?

Field Parameters allow users to dynamically switch columns, measures, or axes via slicers without changing the underlying report.Created using Modeling → New Parameter → Fieds. 
Example: 
Select Sales Amount, Profit Margin dynamically on axis or chart. 

59) Explain the Power BI Report Lifecycle?

Connect to sources. 
Create relationships, DAX. 
Clean, filter, and enrich data. 
Design and build reports. 
Publish to Power BI Service. 
Share via workspaces, apps. 
Schedule refreshes, audit usage. 

60) How does Power BI handle data refresh and scheduling?

Data refresh is triggered manually or scheduled automatically. 
You can schedule refresh up to 8 times/day (Pro) or 48 times/day (Premium). 
Managed through Datasets settings in Power BI Service. Requires Gateways if the data source is on-premises. 

61) What is the function of responsive slicers?

Responsive slicers automatically adjust their size and layout (horizontal/vertical or 
list/dropdown) based on screen size and available space.This improves user experience on different devices (desktop, tablet, mobile). 

62) How do you create a funnel chart in Power BI?

Insert a Funnel visual from the Visualizations pane.  Drag a Category field (e.g., Sales Stage) into Group. 
Drag a Measure (e.g., Total Revenue) into Values. It displays stages from largest to smallest (ideal for sales pipelines, process flows). 

63) What is the difference between a measure and a KPI in Power BI?

Measure: 
A calculation returning a single value (SUM, COUNT, AVG). Logical/analytical component. 
KPI: 
Visual performance indicator for business goals. Visualizes a measure vs a target with trend indicators (good/bad). 

64) Explain the concept of hierarchical slicers in Power BI?

Hierarchical slicers allow users to filter data by drilling down into multiple related 
fields (e.g., Country → State → City). 
Instead of multiple slicers, a single slicer shows all hierarchy levels. 

65) How do you compare of Excel vs Power BI vs Tableau?

66) I have the Month Year in the format MMM-YYYY, but when I use it in a visual, the sorting is not correct. What steps should I take to achieve the correct sort order in Power BI?

Create a separate numeric column like MonthNumber (e.g., 1 for Jan, 2 for Feb). 
Sort the Month-Year column by the MonthNumber column: 
Select column → Sort by Column → choose MonthNumber. 

67) Which functions can I use to obtain MTD, QTD, and YTD results in Power BI? Alternatively, could you provide the formulas for calculating MTD, QTD, and YTD?

MTD (Month-To-Date)TOTALMTD(SUM(‘Sales'[Amount]), ‘Date'[Date]) 
QTD (Quarter-To-Date)TOTALQTD(SUM(‘Sales'[Amount]), ‘Date'[Date]) 
YTD (Year-To-Date)TOTALYTD(SUM(‘Sales'[Amount]), ‘Date'[Date]) 
These use built-in Time Intelligence functions. 

68) Which type of join is preferable between a Date Table and a Transaction Table?

One-to-Many (1: relationship)* is preferable: 
Date table (one unique record per day) → Transaction table (many records for each date). 

69) How can errors be avoided when utilizing time intelligence functions?

Always use a proper Date Table (continuous dates, no gaps). 
Mark the Date Table as “Mark as Date Table” in Power BI. 
Ensure relationships between Date Table and Fact Table exist. 

70) What are the common scenarios in which the Grand Total does not equal the sum of rows in both countable and summable measures?

Row context vs filter context difference. 
Measures like AVERAGEX, RANKX, or custom aggregations cause totals to be re-evaluated, 
not simple sum of values. 
Conditional calculations inside measures can behave differently at total level. 
Use corrected DAX like SUMX() for consistent results. 

71) What is the PL-300 certification?

It’s the Microsoft Power BI Data Analyst Associate certification, focused entirely on Power BI skills. 

72) What does Microsoft PL-300 certification cover?

It validates expertise in data preparation, modeling, visualization, and analysis using Power BI.

73) How deep does it go?

PL-300 goes in-depth into the technical features of Power BI.

74) Are there any prerequisites?

No formal prerequisites, but basic knowledge of data analysis and visualization helps.

75) How to do comparison of PL-900, PL-300, and PL-500?

On Demand Questions:  
(Didn’t find your question in our Power BI interview series or heard something new in a recent interview? Ask your questions. Our expert community will help you with clear, reliable answers straight from  industry experience.) 

76) Should you take PL-300 before PL-900, or does it depend on your goals?

It depends on your goals. If you want to become a Power BI expert, start with PL- 300 for deep, hands-on skills, and take PL-900 later for broader context. If you’re new to the Power Platform, begin with PL-900 to explore all tools and decide your focus. If you’re already confident in Power BI, go directly for PL-300. For business or functional roles, PL-900 alone may be sufficient.

77) So, after passing PL-300, I can go ahead with PL-900, right?

Both PL-900 and PL-300 have no mandatory prerequisites, but choosing the right path depends on your goals.
If you are new to the Power Platform, start with PL-900 to get a foundational understanding of Power BI, Power Apps, Power Automate, and other components.
If your focus is on Power BI, PL-300 is the right choice, as it provides in-depth knowledge of data preparation, visualization, and analysis.
If you already have a basic understanding of Power BI, you can go directly for PL-300 without taking PL-900 first.

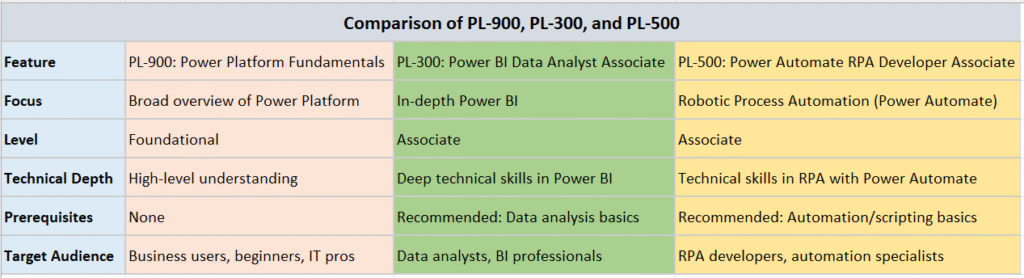
Bottom line: PL-900 is great for beginners, while PL-300 is ideal for those specializing in
Power BI. Choose based on your learning path and career goals.

Power BI Job Roles

Power Bi Interview: Resources, PDFs, and important links:

Have questions or need help?​

If you have any doubts, specific queries, or need further guidance, feel free to reach out! 
Email us at: info@kausalvikash.in
WhatsApp us at: +91-7350070755
 
We’re always happy to support your learning journey! 

Book Your Free Demo Session Now

Thanks for showing interest.

Please complete your registration process and your expert team will come back to you with Demo/Training details.